
June 2023 ENSO update: El Niño is here
BY EMILY BECKERPUBLISHED JUNE 8, 2023
COMMENTS: 8
El Niño conditions have developed, as the atmospheric response to the warmer-than-average tropical Pacific sea surface kicked in over the past month. We expect El Niño to continue into the winter, and the odds of it becoming a strong event at its peak are pretty good, at 56%. Chances of at least a moderate event are about 84%.
El Niño—the warm phase of the El Niño-La Niña climate pattern—changes global atmospheric circulation in known ways, giving us an idea of potential upcoming weather and climate patterns. A stronger El Niño means global temperature, rain, and other patterns are more likely to reflect the expected El Niño impacts. I’ll get into some of the details of those impacts later in this post.
The circus is in town
El Niño conditions are present when we have met all the criteria of our decision tree.
Summary of NOAA decision process in determining El Niño conditions. NOAA Climate.gov drawing by Glen Becker and Fiona Martin.
The monthly Niño-3.4 index, which tracks the temperature of the surface of the tropical Pacific ocean, was 0.5 °Celsius (0.9 ˚Fahrenheit) above the long-term average (long-term = 1991–2020), according to the OISSTv2.1 monthly dataset. 0.5 °C is the threshold for El Niño, so… check! The warm-up following our recent La Niña has been pretty remarkable. We even clocked in a 0.8°C value over the past week in the same dataset, so temperature anomalies are continuing to increase.

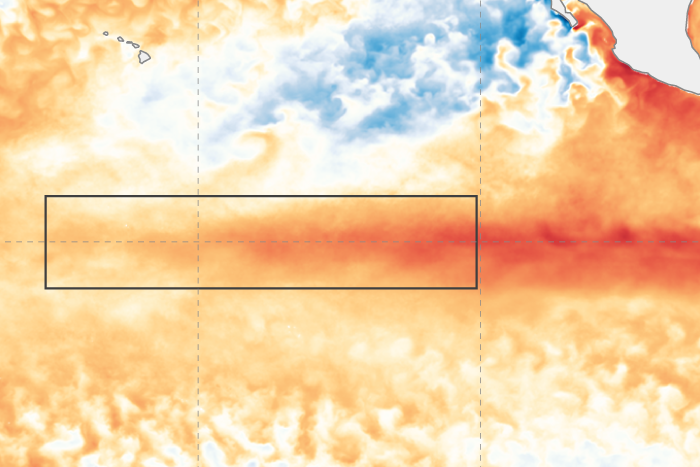
Animation of maps of sea surface temperatures in the Pacific Ocean compared to the long-term average over five-day periods from the end of January to early June 2023. The waters in the key monitoring region, which scientists call "the Niño-3.4 region," start out cooler than average (blue) and progressively become warmer than average (red) as La Niña ends and El Niño arrives. A higher-resolution version of this animation is available as a movie. NOAA Climate.gov, based on Coral Reef Watch maps available from NOAA View.
We anticipate that it will remain above this El Niño threshold for the next several months, based on climate model predictions and current conditions in the tropical Pacific (more on this in a minute)… check! There are the first two of our three rings criteria.
The flying trapeze
The third criteria, “indications of a weaker Walker circulation,” refers to the average atmospheric pattern over the equatorial Pacific. The average Walker circulation is characterized by rising air and storms (convection) over the very warm waters of the far western Pacific, west-to-east winds high up in the atmosphere, descending motion over the relatively cooler waters of the eastern Pacific, and the trade winds—east-to-west surface winds. These strong surface winds help to keep the warm water piled up in the western Pacific.
Generalized Walker Circulation (December-February) during ENSO-neutral conditions. Convection associated with rising branches of the Walker Circulation is found over the Maritime continent, northern South America, and eastern Africa. NOAA Climate.gov drawing by Fiona Martin.
El Niño’s warmer-than-average surface water alters this circulation by bringing more rainfall and convection to the central and eastern Pacific. The trade winds weaken, which allows the surface to warm further, allows warmer water to slosh back eastward, and reinforces the El Niño sea surface temperature pattern. This is the critical feedback mechanism indicative of El Niño.

Generalized Walker Circulation (December-February) anomaly during El Niño events, overlaid on map of average sea surface temperature anomalies. Anomalous ocean warming in the central and eastern Pacific (orange) help to shift a rising branch of the Walker Circulation to east of 180°, while sinking branches shift to over the Maritime continent and northern South America. NOAA Climate.gov drawing by Fiona Martin.
Over the past month, evidence of the weakened Walker circulation appeared in the form of weaker trade winds over the western Pacific and more clouds and rain over the equatorial Pacific. Convection over Indonesia was reduced, too, another characteristic of the weaker Walker circulation.
We quantify the atmospheric component of El Niño using the Equatorial Southern Oscillation Index (EQSOI) and the Southern Oscillation Index (SOI), both of which compare the surface atmospheric pressure in the western Pacific to that in the eastern Pacific (more details on these indexes here). Both measured -1.0 standard deviations in May (meaning the indexes were lower than about two-thirds of all measurements), providing significant indication of the weaker Walker circulation and further evidence that the ocean-atmosphere system has coupled and El Niño conditions have developed.
Ringmaster
We spend so much time and energy studying and forecasting El Niño (and its counterpart, La Niña) because those changes to the atmospheric circulation have global impacts. In a one-paragraph nutshell: warm air that rises near the equator moves toward the poles high up in the atmosphere, descending again near 30 °N and 30 °S, in an overturning pattern called the Hadley circulation. The Hadley circulation is connected with the jet streams over the middle to high latitudes, which steer storms around the world and separate cold and warm air masses.As El Niño heats the atmosphere above the central and eastern tropical Pacific, it leads to a stronger Hadley circulation and changes to the jet streams. For example, in an El Niño winter, an extended North Pacific jet stream tends to bring more storms across the southern tier of the U.S. and warmer air to the northern half of North America.

Since El Niño can usually be predicted months in advance, we can anticipate these changes and their impacts. When El Niño is stronger, meaning the sea surface temperature is much warmer than average, it has a stronger hand in changing global circulation, making the impact patterns more likely.
Of course, nature is full of surprises, and while El Niño makes certain patterns more likely, we never get exactly what we expect! For more on this high-wire act, I’ll let the titles of these two posts speak for themselves: “Not what I ordered: How El Niño is like a bad bartender,” and “No, you can’t blame it all on El Niño… but it’s still a seasonal forecaster’s best friend.”
Fire breather
Along with the atmospheric signs, the subsurface ocean is also providing confidence that El Niño will continue.
Graph showing the average temperature over the past year of the top 300 m (~1000 ft) of the Pacific Ocean, 180-100°W departure from the long-term (1991–2020) average. Graph by climate.gov from CPC data.
There is currently quite a lot of warmer-than-average water under the surface of the Pacific, as one downwelling Kelvin wave (an area of warm water that sloshes from the west to the east under the surface) has passed through and another is emerging. In fact, the May 2023 average subsurface temperature was the fourth-warmest May value in our record (1979–2023). This definitely isn’t a 100% certain indicator that a strong El Niño will develop, but it is suggestive. The top two May values were 1997 and 2015, both of which preceded strong El Niño events, but the third, 1980, did not.
Bring in the clowns
As I mentioned above, nature always has surprises in store, and predicting anything several months in advance is difficult. While El Niño conditions have developed, there’s still a small chance (4-7%) that things will fizzle out. Clearly, we think this is unlikely, but it’s not impossible. The incredible warmth of the global oceans could throw us a curveball, since we’ve not seen this before. Another potential, but also less likely, outcome is a weak El Niño, with about a 12% chance. Check the probabilities for all El Niño outcomes here and read more about forecasting El Niño here.In coming months, I’ll keep you updated on the development of this El Niño. We’ll also have deeper dives into some El Niño impacts, including a post on El Niño’s interaction with global temperature coming up in a couple of weeks. As Nat discussed last month, global temperatures are running way above average, and that has only continued recently. Thanks for spending your time under the big top with us!
June 2023 ENSO update: El Niño is here
El Niño conditions are present and expected to continue into the winter. Our blogger discusses the thinking behind the forecast, including the possibility of a strong El Niño event.