Install the app
How to install the app on iOS
Follow along with the video below to see how to install our site as a web app on your home screen.
Note: This feature may not be available in some browsers.

You are using an out of date browser. It may not display this or other websites correctly.
You should upgrade or use an alternative browser.
You should upgrade or use an alternative browser.
25 years of Snowfall Graphs in Island Park/West Yellowstone (peaks)
- Thread starter christopher
- Start date


V
volcano buster
Well-known member
I believe you can kick those reports out in a csv, post them into one file then chart those years on one graph if you wanted.
Indeed you can. and the compound graph is interesting to look atI believe you can kick those reports out in a csv, post them into one file then chart those years on one graph if you wanted.
But it only really works in the hosted display from the source where you can ISOLATE each year from the other in real time.

To me thats just pretty much WORTHLESS
Just too much data
Five Years is probably the upper limit for real usability

Or perhaps this Upper, Lower and Median Range is of value to show all of the outer limits?


V
volcano buster
Well-known member
You live close.
If I were to visit the area, I would look at probability trends to see when the best opportunities for fresh snow might match a good time to visit.
Once the apparent snow events are noted, I would likely go back and match it with temperature data to see if there were extreme cold events associated with pre/post snow events and or any possible warming trends that are less desireable to ride in. For me a single year is not that informative, the 5 year is a little better. Also, if you have a rough idea of a minimum snow depth needed to enjoy off-trail riding, that can be gleaned as well. I would also target a graph that displayed snow depth vs. snow water equilavent since that is a column weight measure which can be influenced by warm/rain events saturating the snow column.
Fun to play with though.
DING DING DINGThanks for sharing data over a period of years.This shows how much fluctuation there is in caliber of riding days.
You nailed it right there.
The snowfall in Island Park is HIGHLY variable from one season to the next.
What I am working on now is trying to figure out a way of determining TOTAL SNOWFALL for the season.
V
volcano buster
Well-known member
Is there not a setting in the data software?
man, not that I have found.Is there not a setting in the data software?
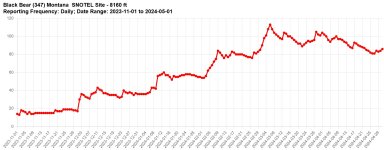
OK, just for kicks and grins.
I downloaded every hourly snow depth report from October 1st through May 15th
That gave me 4,894 cells
4,894/24 = 204 days
Oct 31
Nov 30
Dec 31
Jan 31
Feb 28
Mar 31
April 30
May 15
But the actual count should be 228!
This verifies that the SNOWTEL data set is MISSING MANY MANY HOURLY REPORTS!
Which I can confirm by examining it by hand.
It FREQUENTLY skips, 3-6 hours worth of reporting on a given day.
So my final numbers are ABSOLUTELY SHORT of the truth.
I removed all negative values (Snow melted or compacted in any reporting hour)
That leaves only logged positive snowfall.
Base logged snowfall = 1,058 inches
Then I manually subtract these three "CRAZY" readings by hand
35 inches in one hour
62 inches in one hour
98 inches in one hour
TOTAL LOGGED SNOWFALL for 2024-2025 = "863 Inches"
Last edited:
Dataset
Similar threads
- Replies
- 12
- Views
- 3K
- Replies
- 26
- Views
- 5K
- Replies
- 0
- Views
- 1K
- Replies
- 180
- Views
- 43K
D